
What the published rates show
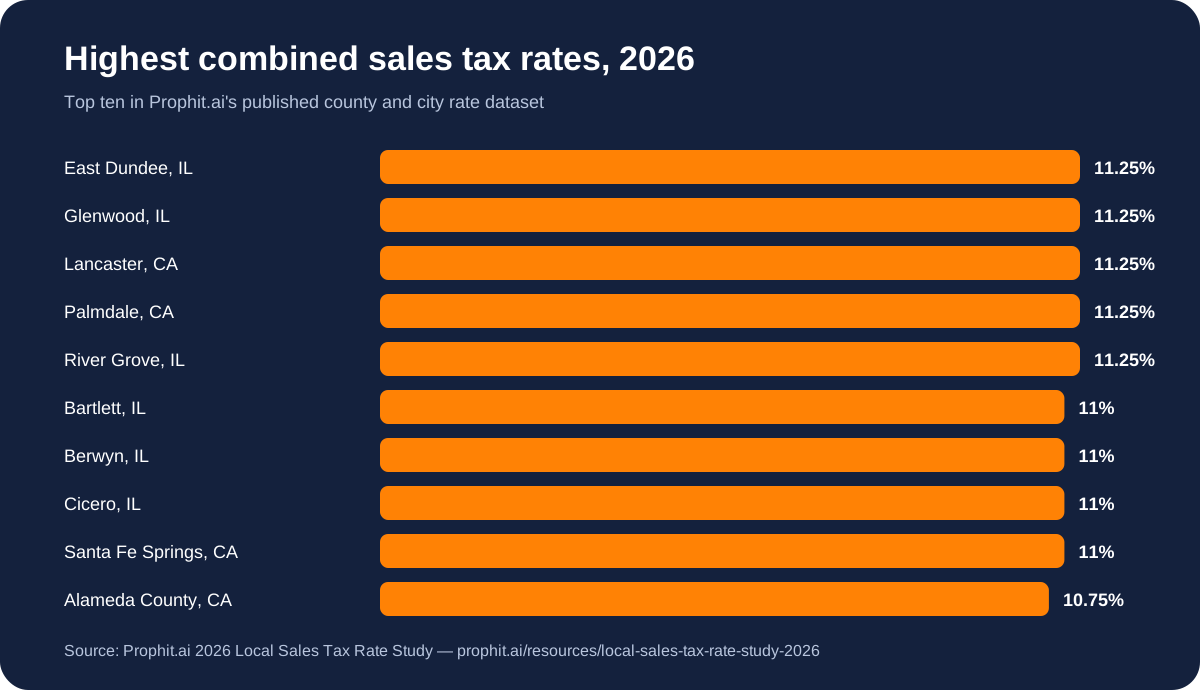
- The highest published combined rate is 11.25% and the lowest is 4% — a 7.25-point spread between two addresses in the same country.
- 258 of 3,837 published localities (6.7%) charge a combined rate of 10% or more.
- 218 localities add no local tax at all — the state rate is the whole rate there.
- Illinois has the widest in-state spread: 6.25% to 11.25%, a 5-point difference that depends entirely on which side of a jurisdiction line an address sits.
- The local layer, not the state rate, drives the extremes: the largest local add-on in this data stacks 5 percentage points on top of the state rate.
- The median published combined rate is 7.75%, so a seller using one "average" rate is wrong in both directions across most of this footprint.
This rate snapshot (13 states as of October 1, 2026; California as of September 14, 2026) covers the 3,837 county and city rates Prophit.ai publishes for 14 states (CA, FL, GA, IL, KS, NV, NY, NC, OH, PA, UT, WA, WI, WY), each pinned to the state's own published rate table. It is not a national ranking: states outside that list — including several with famously high local rates — are not covered, and city-level rows exist only where the state publishes them.
The 25 highest published combined rates
| Locality | State | Type | Combined rate | Local add-on |
|---|---|---|---|---|
| Lancaster | CA | city | 11.25% | +4% |
| Palmdale | CA | city | 11.25% | +4% |
| East Dundee | IL | city | 11.25% | +5% |
| Glenwood | IL | city | 11.25% | +5% |
| River Grove | IL | city | 11.25% | +5% |
| Santa Fe Springs | CA | city | 11% | +3.75% |
| Bartlett | IL | city | 11% | +4.75% |
| Berwyn | IL | city | 11% | +4.75% |
| Cicero | IL | city | 11% | +4.75% |
| Albany | CA | city | 10.75% | +3.5% |
| Azusa | CA | city | 10.75% | +3.5% |
| Compton | CA | city | 10.75% | +3.5% |
| Culver City | CA | city | 10.75% | +3.5% |
| Glendora | CA | city | 10.75% | +3.5% |
| Hayward | CA | city | 10.75% | +3.5% |
| Irwindale | CA | city | 10.75% | +3.5% |
| Lynwood | CA | city | 10.75% | +3.5% |
| Newark | CA | city | 10.75% | +3.5% |
| Oakland | CA | city | 10.75% | +3.5% |
| Pico Rivera | CA | city | 10.75% | +3.5% |
| San Leandro | CA | city | 10.75% | +3.5% |
| Santa Monica | CA | city | 10.75% | +3.5% |
| South El Monte | CA | city | 10.75% | +3.5% |
| South Gate | CA | city | 10.75% | +3.5% |
| Union City | CA | city | 10.75% | +3.5% |
The lowest published combined rates
Where the local layer adds nothing, the state rate is the entire rate.
| Locality | State | Combined rate | Local add-on |
|---|---|---|---|
| Sublette County | WY | 4% | +0% |
| Park County | WY | 4% | +0% |
| Weston County | WY | 5% | +1% |
| Washakie County | WY | 5% | +1% |
| Uinta County | WY | 5% | +1% |
| Natrona County | WY | 5% | +1% |
| Lincoln County | WY | 5% | +1% |
| Laramie County | WY | 5% | +1% |
| Johnson County | WY | 5% | +1% |
| Fremont County | WY | 5% | +1% |
| Crook County | WY | 5% | +1% |
| Converse County | WY | 5% | +1% |
| Campbell County | WY | 5% | +1% |
| Big Horn County | WY | 5% | +1% |
| Winnebago County | WI | 5% | +0% |
How much the rate moves inside one state
The spread column is the difference between the highest and lowest published rate within a single state — the reason a state-level rate is not a usable answer for a specific address.
| State | State rate | Published range | Spread | Highest locality | Localities |
|---|---|---|---|---|---|
| Illinois | 6.25% | 6.25% – 11.25% | 5% | East Dundee | 1,344 |
| Kansas | 6.5% | 6.5% – 10.75% | 4.25% | Kanorado | 749 |
| California | 7.25% | 7.25% – 11.25% | 4% | Lancaster | 517 |
| Utah | 4.85% | 6.35% – 9.55% | 3.2% | Park City | 307 |
| Washington | 6.5% | 7.6% – 10.7% | 3.1% | Edmonds | 324 |
| Georgia | 4% | 6% – 9% | 3% | Banks County | 159 |
| Wyoming | 4% | 4% – 7% | 3% | Teton County | 23 |
| Florida | 6% | 6% – 8% | 2% | Hamilton County | 67 |
| New York | 4% | 7% – 8.875% | 1.875% | New York City | 76 |
| Ohio | 5.75% | 6.5% – 8.25% | 1.75% | Licking County | 88 |
| Nevada | 6.85% | 6.85% – 8.375% | 1.525% | Clark County | 16 |
| Pennsylvania | 6% | 7% – 8% | 1% | Philadelphia | 2 |
| Wisconsin | 5% | 5% – 5.9% | 0.9% | Milwaukee County | 72 |
| North Carolina | 4.75% | 6.75% – 7% | 0.25% | Alexander County | 93 |
Coverage and methodology
This rate snapshot (13 states as of October 1, 2026; California as of September 14, 2026) covers the 3,837 county and city rates Prophit.ai publishes for 14 states (CA, FL, GA, IL, KS, NV, NY, NC, OH, PA, UT, WA, WI, WY), each pinned to the state's own published rate table. It is not a national ranking: states outside that list — including several with famously high local rates — are not covered, and city-level rows exist only where the state publishes them.
Each state's rates come from that state's own published rate table, with the effective window recorded; the per-state sources are listed on every locality page and in the CSV. Rates are combined state plus local rates for general merchandise; product-specific rates, district overlaps that a state does not publish at this level, and special impositions are out of scope. This study is an independently pinned historical publication. The Prophit.ai Sales Tax Engine uses its own effective-dated runtime content; this snapshot does not establish current engine rates.
- Illinois: Illinois DOR machine-readable rate file (ORDMACHE) (Rates in effect on October 1, 2026 (IDOR current file; latest changes effective August 1, 2026)) — official source
- Kansas: Kansas DOR jurisdiction code and rate table (2026-10-01 to 2026-12-31) — official source
- California: CDTFA city and county tax rates (TAC table) (2026-07-01 to 2026-09-30) — official source
- Utah: Utah State Tax Commission sales & use tax rate charts (2026-10-01 to 2026-12-31) — official source
- Washington: Washington DOR local sales & use tax rates (Q4 2026) (2026-10-01 to 2026-12-31) — official source
- Georgia: Georgia Department of Revenue rate chart (2026-10-01 to 2026-12-31) — official source
- Wyoming: Streamlined Sales Tax Governing Board rate file (Rates in effect on October 1, 2026 (2026 Q4 rate file)) — official source
- Florida: Florida DOR discretionary sales surtax table (DR-15DSS) (2026-01-01 to 2026-12-31) — official source
- New York: New York State DTF Publication 718 (Pub 718 current edition) — official source
- Ohio: Ohio Department of Taxation rates, distributed by SSTGB (Rates in effect on October 1, 2026: county rates from the 2026 Q4 SSTGB rate file, transit authority components from the 2026 Q1 UST-1 capture) — official source
- Nevada: Nevada Department of Taxation county sales tax rate map (ADM-T047) (Rates in effect on October 1, 2026 (current SSTGB edition; no 2026 Q4 change was posted)) — official source
- Pennsylvania: Pennsylvania Department of Revenue tax rates (Effective since 1994 (Allegheny) / 1998 (Philadelphia)) — official source
- Wisconsin: Streamlined Sales Tax Governing Board rate file (Rates in effect on October 1, 2026 (2026 Q3 rate file, republished unchanged for 2026 Q4)) — official source
- North Carolina: Streamlined Sales Tax Governing Board rate file (Rates in effect on October 1, 2026 (2026 Q3 rate file; no rate change was published for 2026 Q4)) — official source
Cite this data
Free to cite, quote, or embed with attribution: “Prophit.ai 2026 Local Sales Tax Rate Study, https://prophit.ai/resources/local-sales-tax-rate-study-2026”. Need a different cut — one state, counties only, or rates above a threshold? Ask; it comes from the same dataset.
Related: the 2026 filing calendar, the Sales Tax Atlas, and the 2026 software pricing index.
Rate snapshot 13 states as of October 1, 2026; California as of September 14, 2026; guide reviewed October 20, 2026. General information, not tax advice; confirm the current rate and effective date against the state source before filing.